
In the world of trading and investing , understanding basic concepts like support and resistance is very important. These concepts are basics fundamental to technical analysis , helping traders and investers to make informed decisions about buying and selling of stocks. let’s know in this blogpost about support and resistance and how they guide your trading strategy.
What is Support?
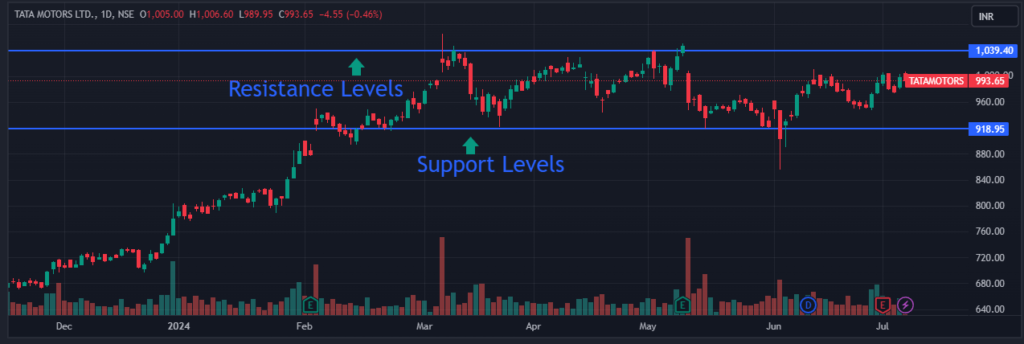
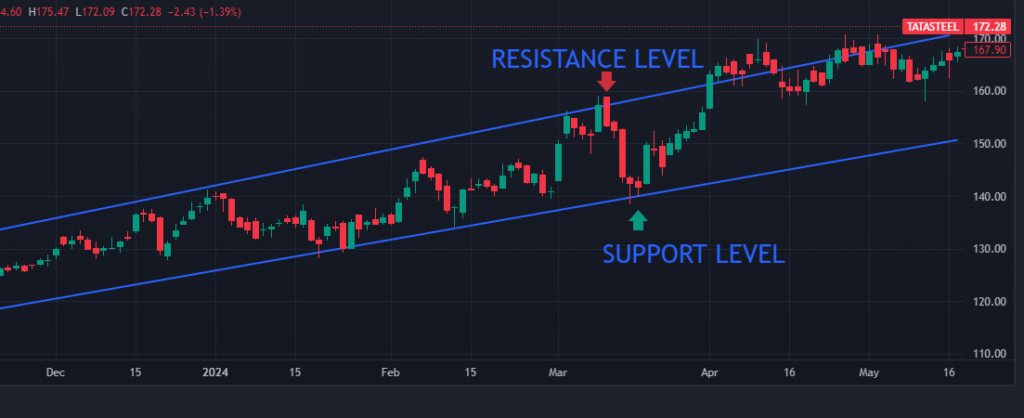
Support is a price level where a stock tends to find buying intrests as it falls. At this levels, traders believe the stock is undervalued, so they start buying, which prevents the price from further. Think of it as a floor that stops the stock from dropping. For example, if a stock repeatedly falls to Rs. 50 and then bounces back up Rs. 50 is the support level.
What is Resistance?
Resistance is the opposite of support . It is a price level where a stock faces selling pressure as it rises. At this level, traders believe the stock is overvalued, so they start selling, which prevents the price from rising further. Think of it as a ceiling that stops the stock from climbing. For example , if a stock repeatedly rises to Rs. 100 and then falls back, Rs. 100 is the resistance level.
How to Identify Support and Resistance Levels
1. Historical Price Points:
Look at past price movements. Support and resistance levels often occur at historical price points where the stock has previously changed direction.
2. Trend Lines:
Draw trend lines connecting multiple high points or low points. These lines can act as a support or resistance.
3. Moving Averages:
Commonly used moving averages , like the 50-day or 200-day moving averages often act as dynamic support or resustance levels.
Why are Support and Resistance Important?
1. Decision Making:
They help traders decide where to enter or exit a trade. Buying near support and selling near resistance can be a profitable strategy.
2. Risk Management:
Knowing these levels allows traders to set stop-loss orders just below support or above resistance to limit potential losses.
3. Market Sentiment:
These levels reflects market sentiment. When a stock breaks through support or resistance, it indicates a change in sentiment and can lead to significant price movements.
Practical Tips for Using Support and Resistance
1. Be Flexible:
Support and resistance are not exact levels, they are zones. Price may slightly break through these levels before reversing.
2. Use Multiple Indicators:
Combine support and resistance analysis with other technical indicators like RSI, MACD, or volume to confirm signals.
3. Monitor Volume:
Higher trading volume near support and resistance levels can indicate stronger buying or selling interest, making the levels moresignificant.
Conclusion
Support and resistance are powerful tools in technical analysis. By understanding and applying these concepts,traders can make more informed decisions, manage risk effectively, and improve their chances of success in stock market. Remember no strategy is foolproof, so always combine support and resistance analysis with other tools and stay updated with market trends. Happy Trading.